Create Split Image
Usage
giplt create_split_image.py <input image 1> [<input image 2> <input image 3> .... ] <output image>
Description
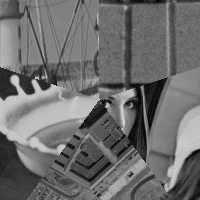
This scripts loads one or more images and creates a split image, where each of the images is displayed in a cone of equal angle. See figure 1 for a sample image.

Figure 1: Split image
Script
import sys
from math import *
from ost.geom import *
from ost.img.alg import *
from ost.img import *
from ost.io import LoadImageList, SaveImage

def CreateSplitImage(imagelist, start_at_y=True):
    result=imagelist[0].Copy(False)
    result.CenterSpatialOrigin()
    extent=imagelist[0].GetExtent()
    if start_at_y:
            startpoint=Vec2(0.0,-extent.GetSize()[0])
    else:
            startpoint=Vec2(extent.GetSize()[0],0.0)
    angle=2*pi/len(imagelist)
    count=0
    for image in imagelist:
            image.CenterSpatialOrigin()
            start_angle=angle*count
            end_angle=angle*(count+1)
            pol=Polygon2()
            pol.AddNode(Vec2(0,0))
            pol.AddNode(Rotate(startpoint,start_angle))
            if(start_angle<pi/4.0 and end_angle>pi/4.0):
                    pol.AddNode(Rotate(startpoint,pi/4.0))
            if(start_angle<3.0*pi/4.0 and end_angle>3.0*pi/4.0):
                    pol.AddNode(Rotate(startpoint,3.0*pi/4.0))
            if(start_angle<5.0*pi/4.0 and end_angle>5.0*pi/4.0):
                    pol.AddNode(Rotate(startpoint,5.0*pi/4.0))
            if(start_angle<7.0*pi/4.0 and end_angle>7.0*pi/4.0):
                    pol.AddNode(Rotate(startpoint,7.0*pi/4.0))
            pol.AddNode(Rotate(startpoint,end_angle))
            m=Mask(pol)
            result+=image.Apply(MaskImage(m))
            count+=1
    return result

imagelist=LoadImageList(sys.argv[1:-1])
result=CreateSplitImage(imagelist)
SaveImage(result,sys.argv[-1])
You can download the script here.

 Documentation
 Download
 News
News Gallery
 Contact